

Breaking Down Laboratory Finances: Origins and Allocations
November 14, 2023Cost-Per-Test: Exploring the What and Why
November 28, 2023Understanding the data: What Should I Consider?
For a laboratory, a financial strategy built on and supported by data is crucial for achieving financial success. Thus, it is necessary to determine the required data, its sources, and the appropriate actions once acquired. Business Intelligence (BI) methods and tools are essential in uncovering insights within the volumes of seemingly complex laboratory finance data. When analyzing financial and staff data, setting your focus is needed. We will explore key areas that merit attention in a comprehensive BI analysis.
Business Intelligence
What is business intelligence? BI refers to a set of technologies, processes, and tools that you can use to collect, analyze, and present data, transforming raw data into meaningful information. BI solutions often involve dashboards, reports, and visualizations, rendering complex data sets more accessible and understandable for users across the organization. Enhance your competitiveness and agility in the new data-driven landscape by employing BI.
BI for Laboratory Finance Data
How can we use this knowledge and apply it to laboratory finance data? The first requirement will be to establish a goal. What is your goal, meaning what do you want to achieve? Setting your goal will inform you of the additional data you will need. For instance, we want to use a profit-per-test calculation to comparatively analyze the profitability of our tests and clinical departments across multiple sites.
Taking information from this post, where we looked at some financial concepts like revenue, expenses, and an accurate cost per test, we can start constructing the diagram below to get to the calculations required.

Cost metric calculations
We can calculate, for each test, their revenue and costs by using additional test volume data combined with the revenue and expenses data. Multiple methods of calculating cost-per-test exist, and we will assess them in the subsequent posts, so keep an eye out for them!
Now construct a basic hierarchy against which to interrogate these values, like the diagram below:
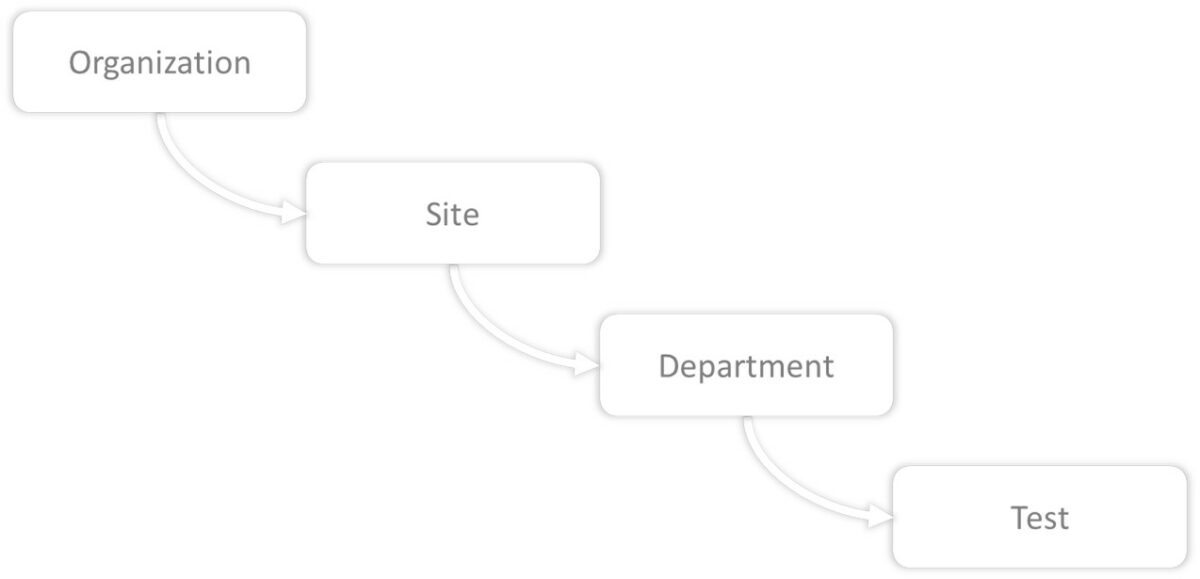
Basic Laboratory Hierarchy
Aggregate the data in the hierarchy from the per-test values for revenue, costs, and profit to create new and telling results. For instance, if we sum the cost-per-test values up to the department level, we get the cost-per-department, which can again be valuable information.
BI Context: Critical Perspective
Before delving into in-depth interrogations of your company financial data, a crucial aspect of BI analytics is context. Understanding the context inherent to the data analyzed, or external, is paramount.
An example of external context would be that the increase in revenue might be due to the current extensive marketing campaign. Keep these external context factors in mind when performing data analysis.
Inherent context is equally important and deals with the selection or filters placed on the results you are looking at. For instance, you calculate the Sum of all Costs. You have also classified your costs and have filtered the costs to show only material costs. Your Sum of all Costs metric is actually now a “Sum of all Material Costs” metric.
Therefore, understanding the context of the results and every calculated value is crucial for making informed decisions and avoiding misleading conclusions.
Laboratory Finance Analysis
Armed with this powerful tool at your disposal, where will you start? What analysis goals will you set, and which truths will you uncover? Here are some examples of investigations:
Cost Analysis
To perform a detailed cost analysis, classify your expenses, as mentioned in this post. You can track these costs over time to assess whether they are escalating and verify that the increases align with your laboratory growth or if there are potential areas for optimization and savings.
Assessing data over time allows you to identify trends and supports proactive decision-making.
Price point
It is equally crucial to evaluate not just your costs but also your income. Analyze the profitability to identify specific high-margin tests, as this will allow you to explore opportunities for expanding or further optimizing these offerings.
Use your new cost-per-test calculation to support your test price point and track the impact of any pricing changes over time.
Efficiency and cost effectiveness
Two significant cost drivers, typically found in laboratories, are staff and equipment. Therefore, resource allocations are critical for running a cost-effective laboratory. Cost-per-test based comparative analytics can applied on similar tests across different laboratories or sites. A cost analysis can highlight locations with better use of laboratory staff, superior analyzers, or enhanced testing processes and protocols. Employing better practices and equipment across your organization can prove a potential cost-saving exercise.
Conclusion
Effectively utilizing financial and staff data with targeted BI analysis is instrumental in supporting a sound financial strategy. Ensure long-term sustainability with growth through detailed cost analysis, defense of pricing strategy, and efficient and cost-effective laboratory operations.
